Dashboards & Reporting
Reporting & Data Management – From Operational Data sharing to Business Insight
Cuberdon provides powerful and flexible reporting capabilities designed to turn operational data into clear, actionable insights. Built around a robust data architecture, the platform enables organizations to collect, structure, enrich, and analyze data across systems — while keeping full control over reporting formats and evolution.
Flexible Data Imports & Exports
- Cuberdon supports data management through configurable import and export mechanisms.
- Import profiles can be tailored per data source, allowing precise control over file structure, transformation rules, and validation logic.
- Multiple file formats are supported, including CSV, Excel, PDF, XML, and JSON.
- On the output side, exports are fully configurable and adapted to your reporting needs.
- Data can be exported in Excel or structured formats, filtered by business criteria, and made available directly through the user interface for consultation or download.
Operational Data Store (ODS) for Advanced Analytics
- At the heart of the reporting architecture lies the Operational Data Store (ODS), designed to centralize and structure operational data for analysis.
- The ODS can be directly connected to your preferred business intelligence tools, such as Power BI, enabling advanced reporting, dashboards, and data modeling without impacting transactional performance.
- This separation between operational systems and analytics ensures scalability, performance, and long-term flexibility.
Data Quality & Consistency
- Built-in mechanisms for duplicate detection and data merging help maintain data quality and consistency across datasets.
- Configurable merging logic ensures that business rules are respected while reducing redundancy and manual corrections.
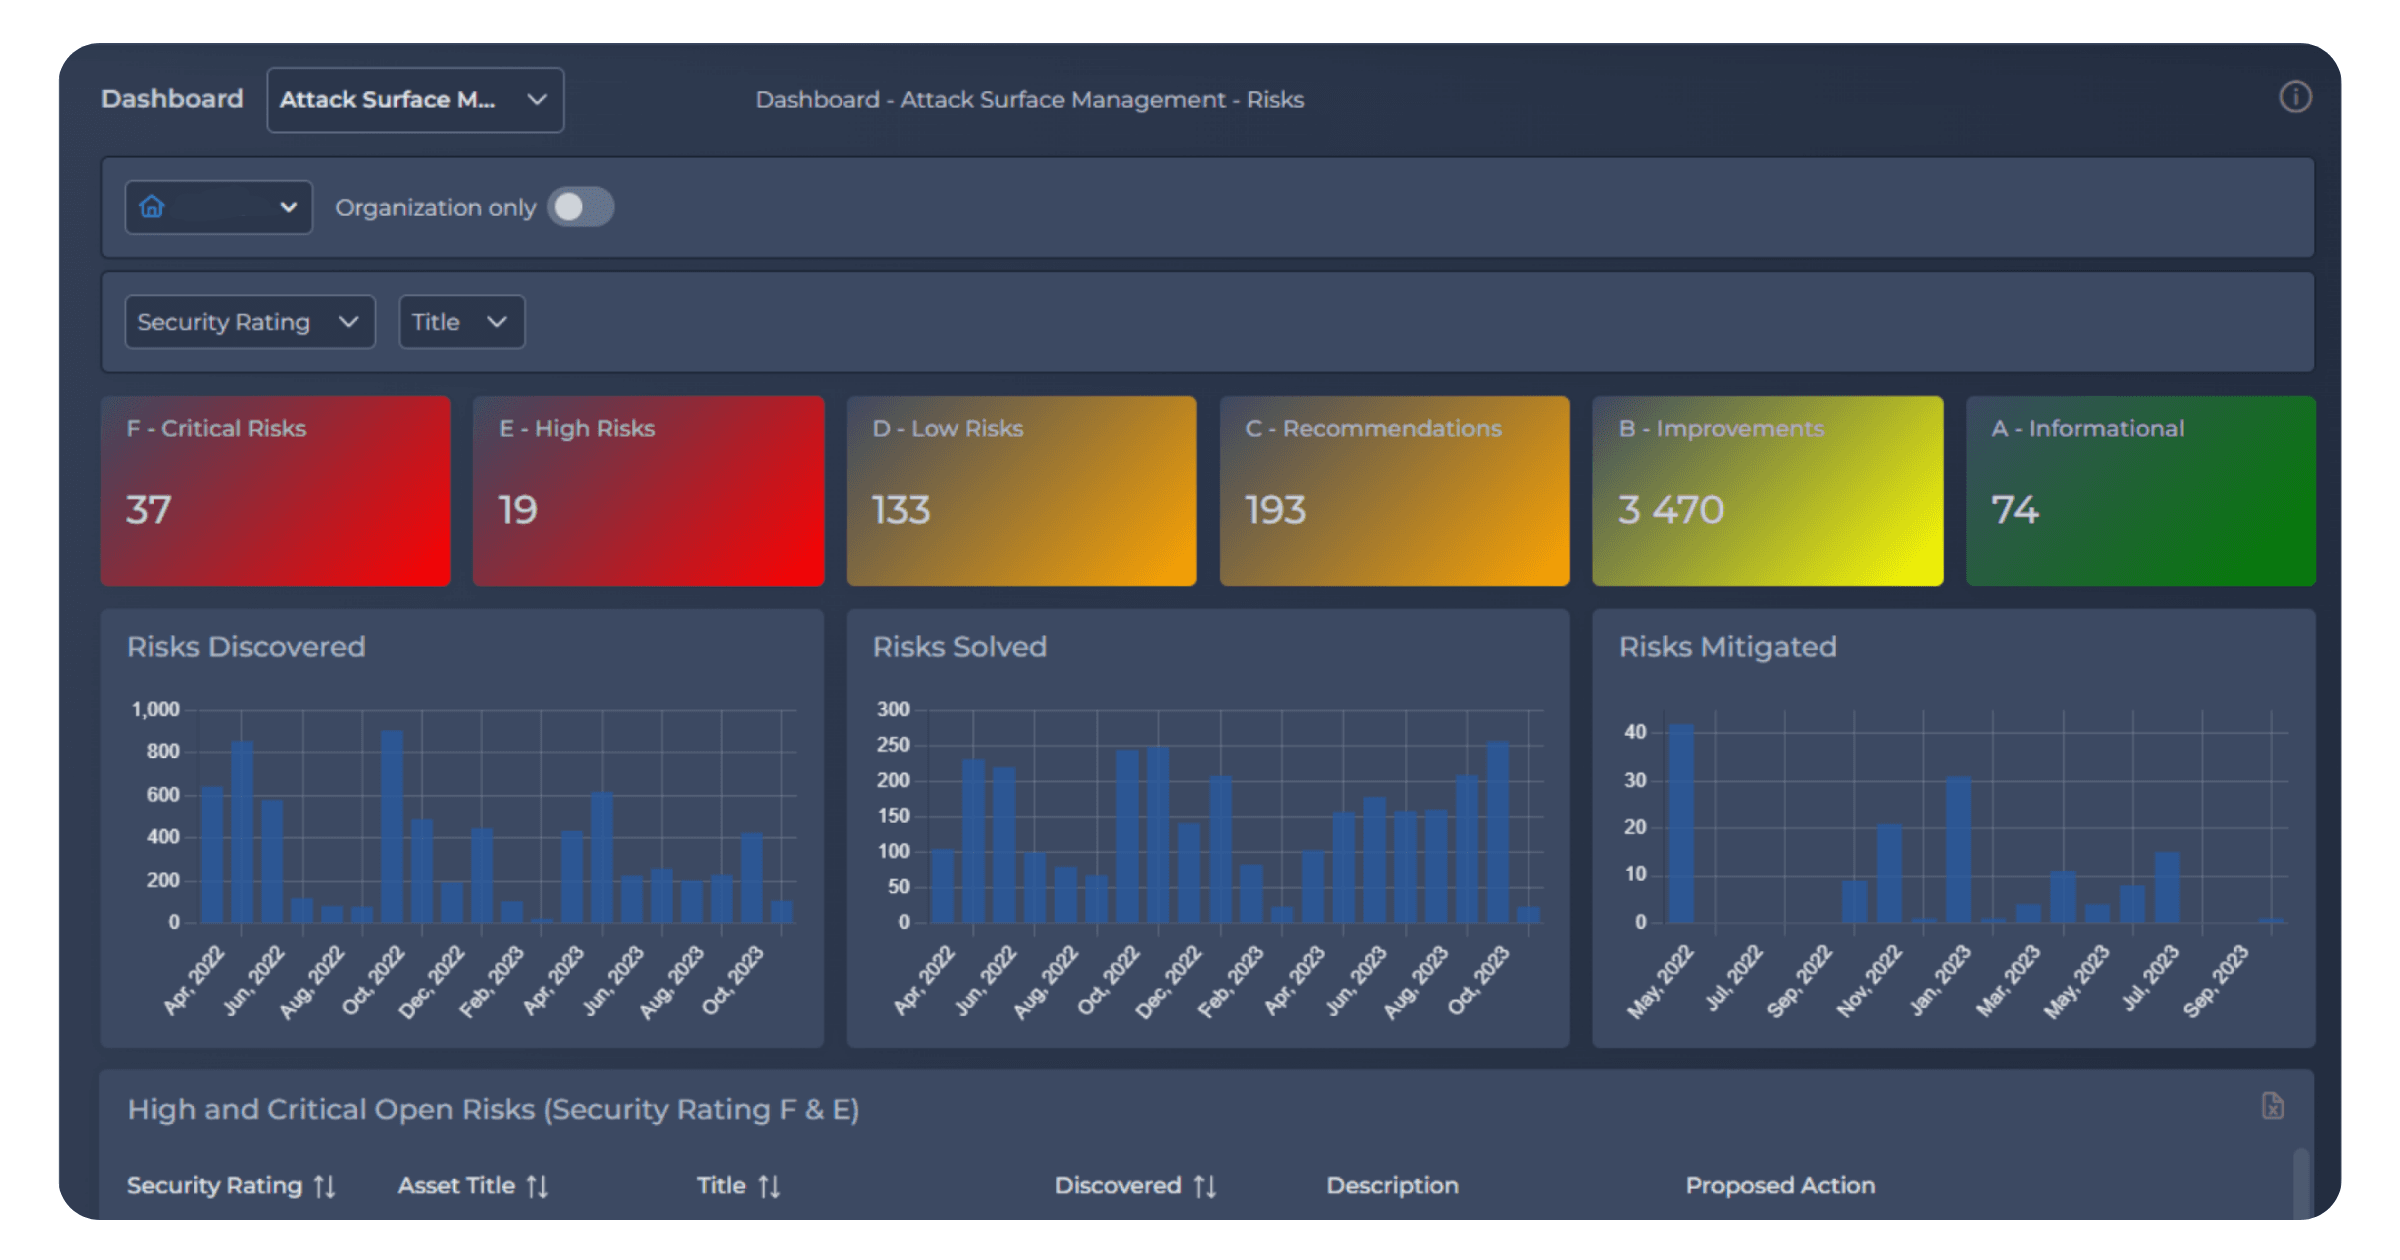
Dashboards, Widgets & Real-Time Views
Cuberdon includes dashboard and widget capabilities that allow data to be visualized directly within the platform. Through secure connections (fixed IP or open APIs), data can be extracted from internal or external sources and displayed as widgets, lists, or aggregated views.
Users can:
- Create dashboards composed of configurable widgets
- Perform periodic aggregations within the platform
- Drill down into detailed data on demand via web APIs
- A dedicated dashboard studio empowers customers to continuously adapt and evolve their reporting views without technical intervention.
Controlled Access & Visibility
- Reporting visibility is fully configurable based on organizational structures and user memberships.
- Hierarchical access rules ensure that each user sees the right data at the right level